Get trajectories from a Bayesian model result
Source:R/trajectoriesFromBayesian.R
trajectoriesFromBayesian.RdGet sample trajectories and summaries from a fitted Bayesian model. The
returned example trajectories are derived from the MCMC samples. If we also
provide initial population size information then the projection (by default)
includes density dependence and demographic stochasticity and populations can
go extinct. Note that in this case the form of the growth model (density
dependence & demographic stochasticity, but not interannual variability) can
be changed by setting caribouPopGrowth() function parameters. The
Bayesian MCMC samples include interannual variation in recruitment and
survival, so no additional interannual variation is added by
caribouPopGrowth().
Usage
trajectoriesFromBayesian(
  bayesianResults,
  N0 = NULL,
  cPars = demographyDefaults(),
  returnSamples = TRUE,
  doSummary = TRUE,
  ...
)
Arguments
- bayesianResults
A result from
estimateBayesianRates- N0
number or dataframe. Optional. Initial population size(s). If NA (default) then population growth rate is \(\lambda_t=S_t*(1+cR_t)/s\). If a data frame N0 column is required, and PopulationName column is required if there is more than one row. Additional (optional) variation columns will be used by
addN0Variation().- cPars
optional. Parameters for calculating composition survey bias term.
- returnSamples
logical. If FALSE returns only summaries. If TRUE returns example trajectories as well.
- doSummary
logical. Default TRUE. If FALSE returns unprocessed outcomes from caribouPopGrowth. If TRUE returns summaries and (if returnSamples = T) sample trajectories from prepareTrajectories.
- ...
Additional arguments passed to
caribouPopGrowth
Value
If doSummary is TRUE and returnSamples is TRUE a list with elements:
summary: a data.frame mean, lower (2.5%) and upper (97.5%) for each metric.
samples: a data.frame providing the full range of trajectories from the model. It is in a long format where "Amount" gives the value for each metric in c, survival, recruitment, X, N, lambda, Sbar, Rbar, Xbar, and lambda_bar, with a row for each combination of "MetricTypeID", "Replicate", "Year", "LambdaPercentile" and PopulationName.
surv_data and recruit_data: data.frames with recruitment and survival data
popInfo: data.frame of population information including N0, PopulationName and c.
If doSummary is FALSE a data.frame with the output from caribouPopGrowth()
Interpretation of Years
Throughout the package a year is treated as the calendar year only if it is in a table that also contains a month column. In all other contexts year is treated as the caribou year which is the annual demographic cycle of caribou, measured from one calving season to the next. By default, April is set as the start of the caribou year.
See also
Caribou demography functions:
addMissingYears(),
addN0Variation(),
bayesianScenariosWorkflow(),
bayesianTrajectoryWorkflow(),
betaNationalPriors(),
caribouPopGrowth(),
compareTrajectories(),
compositionBiasCorrection(),
convertTrajectories(),
dataFromSheets(),
demographicProjectionApp(),
estimateBayesianRates(),
estimateNationalRate(),
getCaribouYear(),
getNationalCoefficients(),
getScenarioDefaults(),
plotCompareTrajectories(),
plotSurvivalSeries(),
plotTrajectories(),
popGrowthTableJohnsonECCC,
simulateObservations(),
trajectoriesFromNational(),
trajectoriesFromSummary(),
trajectoriesFromSummaryForApp()
Examples
surv_data <- bboudata::bbousurv_a %>% filter(Year > 2010)
recruit_data <- bboudata::bbourecruit_a %>% filter(Year > 2010)
bbouInformative <- estimateBayesianRates(surv_data, recruit_data,
                                         return_mcmc = TRUE)

trajB <- trajectoriesFromBayesian(bbouInformative)
str(trajB, max.level = 1)
#> List of 5
#>  $ summary     :'data.frame':	60 obs. of  8 variables:
#>  $ samples     :'data.frame':	198000 obs. of  8 variables:
#>  $ surv_data   :'data.frame':	84 obs. of  9 variables:
#>  $ recruit_data:'data.frame':	6 obs. of  9 variables:
#>  $ popInfo     :'data.frame':	3000 obs. of  4 variables:
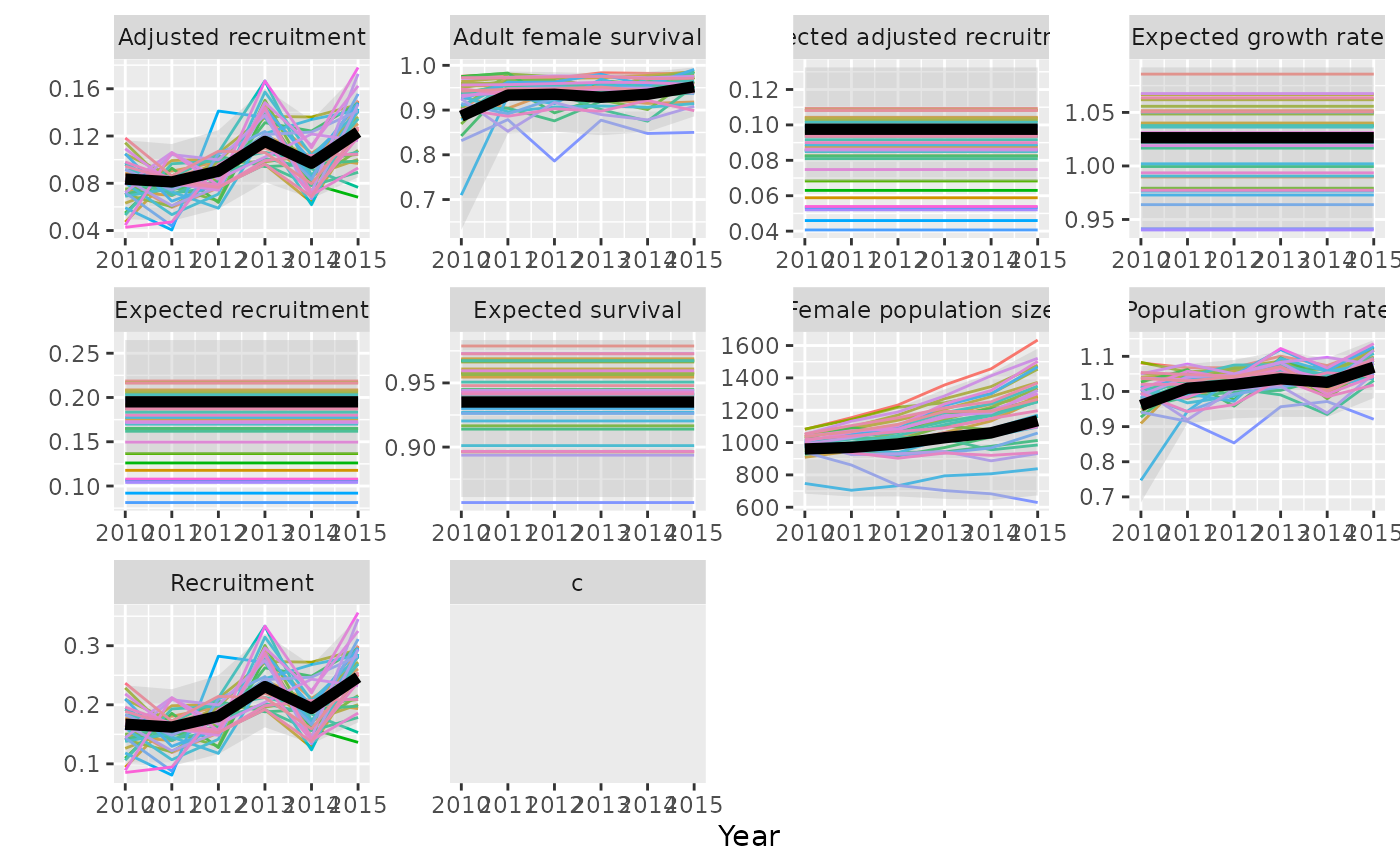
plotTrajectories(trajB)
#> Warning: Removed 420 rows containing missing values or values outside the scale range
#> (`geom_line()`).
#> Warning: Removed 12 rows containing missing values or values outside the scale range
#> (`geom_ribbon()`).
#> Warning: Removed 12 rows containing missing values or values outside the scale range
#> (`geom_line()`).